SpectralColorimetryLAB / RGBMetamerism
Module · Color

One color. One truth. Across every site.

Spectral color archive with standards, LAB/RGB conversion and light simulation, with permissions and workflow.

Scroll
Benefits

What Color Managed Library makes possible.

  • 01Spectral instead of only LAB or RGB values
    Spectral data describes the full reflectance curve of a color, not just three coordinates. It reveals metamerism, keeps the color independent of light source and device, and provides the only data basis that stays reproducible across the supply chain.
  • 02Light simulation D65, A, TL84 …
    Every color can be simulated under daylight (D65), incandescent (A), retail floor light (TL84) and further standard illuminants at a click. You catch metamerism risks before the product hits the shop floor.
  • 03Standard, lab and bulk values connected
    Standard, lab sample and bulk production live in one record. dE values, tolerances and approvals are linked, instead of scattered across spreadsheets, emails and supplier portals.
  • 04Visible to every stakeholder, worldwide
    Designers, suppliers, QA and compliance work worldwide on the same validated color. Roles, permissions and an audit trail are built in, so every change stays traceable.
  • 05Search and cross-reference
    Find colors by name, code, season, supplier, collection or spectral proximity. Cross-reference links external standards (Pantone, RAL, in-house codes, supplier IDs) to your spectral reference, so one color stays one truth no matter how many names it carries.
Workflow

How Color Managed Library fits into your reality.

  1. 01

    Store the standard

    Spectral reference from measurement, not from gut feeling.
  2. 02

    Validate the match

    MatchBox compares lab and bulk data against the standard.
  3. 03

    Distribute

    Designers, suppliers and QA work on the same color.
Spectral color science

What makes color truly comparable.

Light source · D65

Spectral reflectance curve, live.

Switch color and light source. See why the same spectrum projects to a different RGB and LAB under different light.

3804304805305806306807300%50%100%
Rendered color under D65
sRGB
#DBCFB5
L
83.5
a
-0.1
b
14.5

Illustrative spectra and simplified observer data. In DMIx you work with real measurements from your spectrophotometer.

Spectral vs. RGB / LAB.

Why brands, suppliers and QA work from spectral data, not display projections.

Data basis
RGB
3 channels
LAB
3 coordinates
Spectral
Full reflectance curve
Light source dependency
RGB
High
LAB
Medium
Spectral
None (illuminant independent)
Metamerism detectable
RGB
No
LAB
Partially
Spectral
Fully
Device independent
RGB
No
LAB
Partial
Spectral
Yes
Supply chain reproducibility
RGB
Low
LAB
Medium
Spectral
High
Suitability for QA and audit trail
RGB
Not suitable
LAB
Limited
Spectral
Recommended
Recommended use
RGB
Screens
LAB
Design approvals
Spectral
Production and QA across the supply chain

Spectral data is the source. RGB and LAB are derived projections, valid only under an assumed light source.

Tool · DMIx Measure

DMIx Measure: color measurement, color metrics and color-accurate display.

Color perception plays a central role in product development and evaluation. That is why a key part of our work is the objective measurement and colorimetric analysis of colors.

DMIx Measure is the tool for this, as part of the Color Library. With DMIx Measure, measurement devices from the major manufacturers can be connected, colors measured and colorimetrically analyzed. Colors are no longer just described or photographed, they are translated into objective digital values.

A particular strength of DMIx is that the platform is fully color managed. Users can store a monitor profile in their setup and, in combination with a calibrated monitor, achieve a color-accurate display. Digital color and material data is not only measured and stored, it is also controlled and reliably visualized.

Inside the tool

Delta E comparison, spectral curves and color-accurate visualization in DMIx Measure.

DMIx Measure / Delta E Comparison
Screenshot of the Delta E comparison view in DMIx Measure showing LAB plot, spectral curves and result table.
  • ΔE 2000, ΔL, ΔAB, MI, WI, TI
    Full colorimetric analysis
  • 380 to 730 nm
    Spectral curves, not just LAB
  • D50 / D65 / TL84 / A
    Multiple illuminants and observers
01

Why does this matter?

Because digital color values create a shared foundation. Everyone involved can access the same value and talk about the same color.

  • 01Less subjective interpretation
  • 02Better communication
  • 03Clear specifications for suppliers
  • 04Measurable quality control
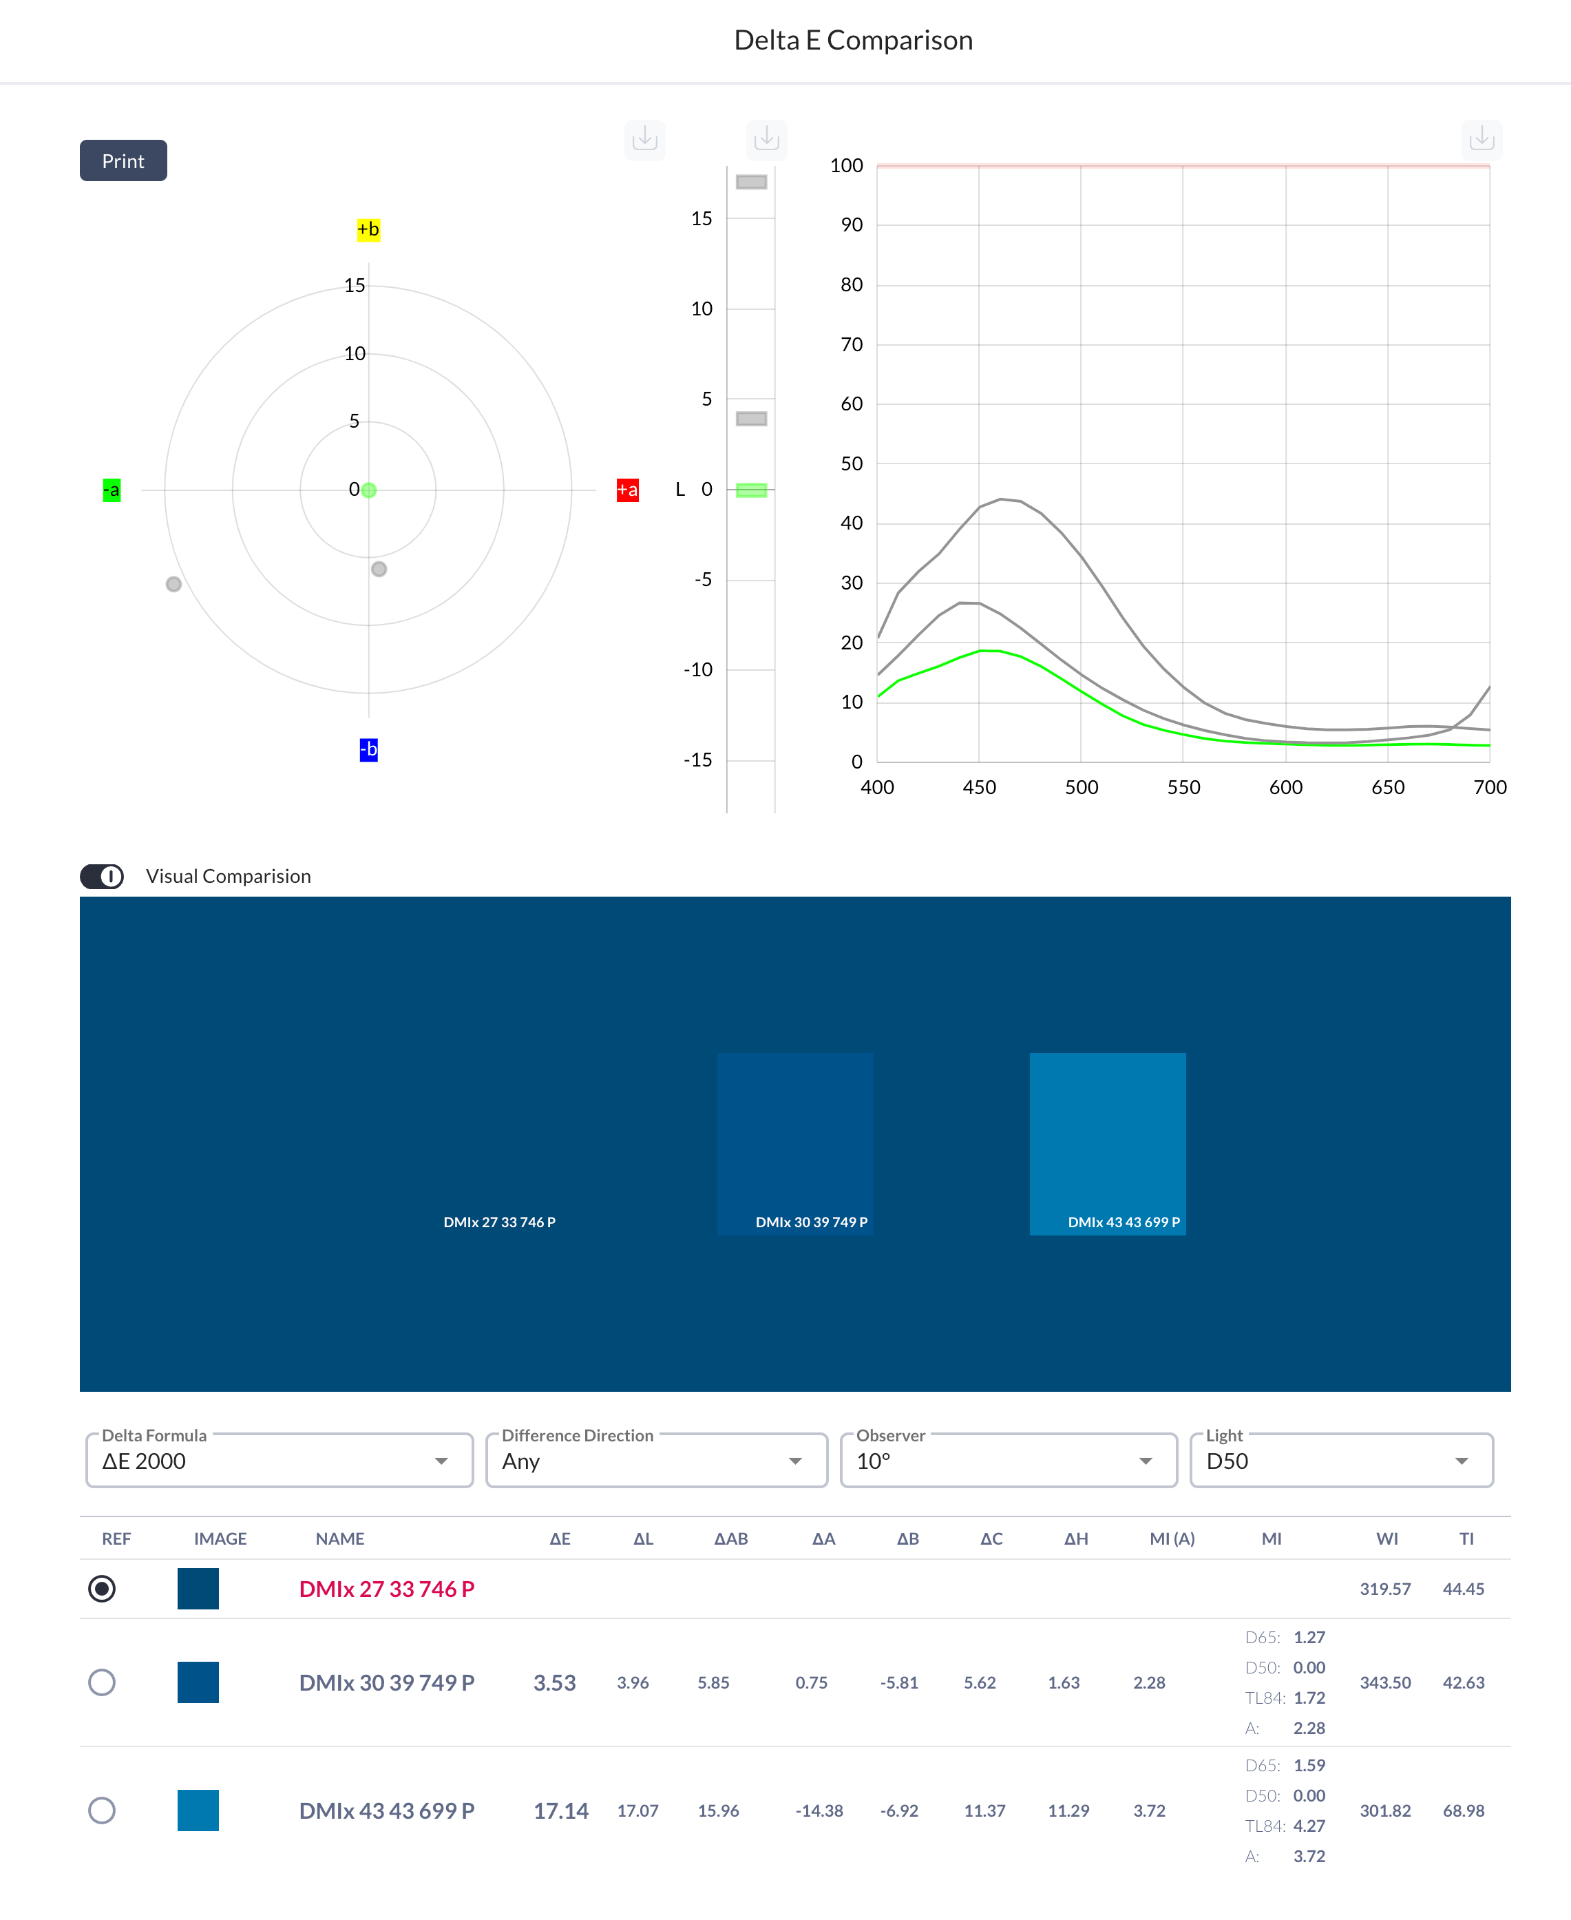
  • 05Complete colorimetric review and evaluation
  • 06Color-accurate display on calibrated monitors
  • 07Reliable basis for a wide range of use cases

Factors that can influence color perception, such as environment and lighting, are reduced or removed from the assessment.

02

What becomes possible?

Measured and colorimetrically analyzed colors can be used for different purposes and converted mathematically, for example for:

  • 01Color-accurate on-screen display
  • 02Print processes
  • 03Industrial color processes
  • 04Quality control
  • 05Cross-referencing with existing supplier colors
  • 06Communication between brand, supplier and production

Once a supplier has printed, dyed or otherwise produced a specified color, it can be checked objectively how closely that color was matched.

This matters especially in digital review: DMIx reduces not only the subjectivity of color measurement, but also the uncertainty of color display on screen.

Gut feeling becomes measurable product reality.

In context

Related use cases

SpectralColorimetryLAB / RGBMetamerism
Ready?

Experience Color Managed Library live in your own workflow.

We show you DMIx on your data, no generic pitch.